
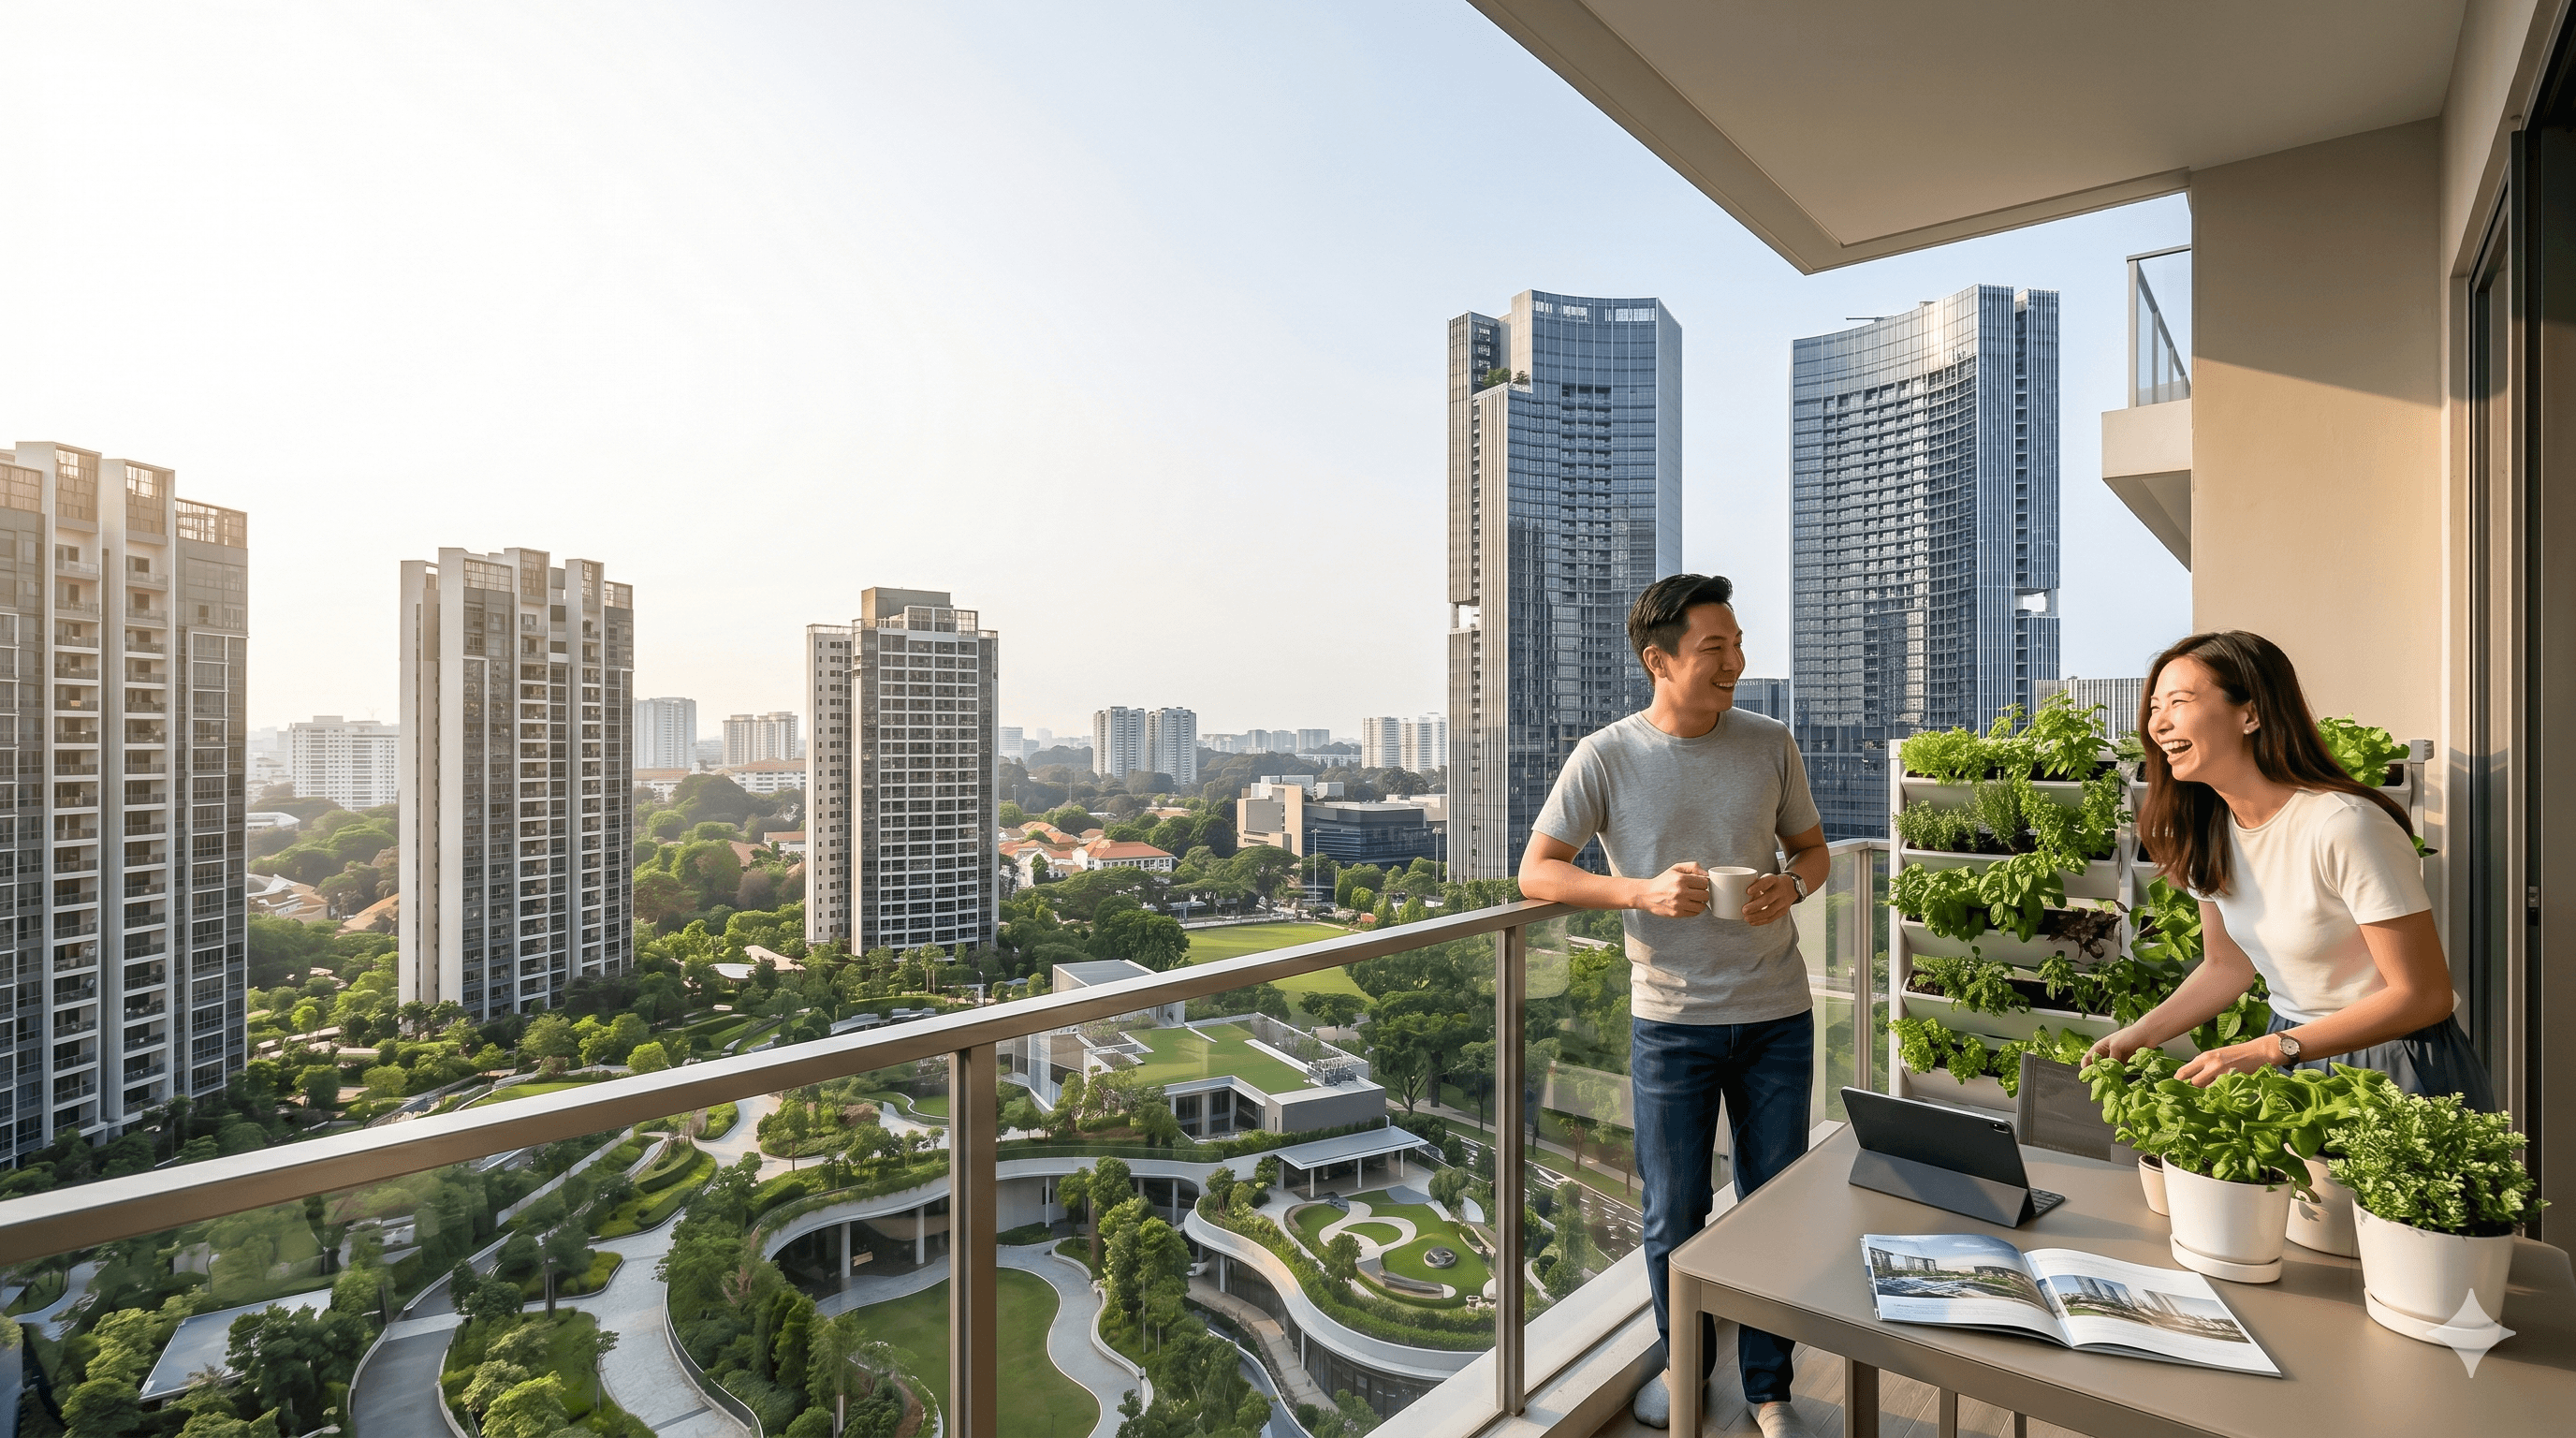
Singapore Private Home Sale Prices Transactions Overview — 22 June 2026
Transacted private home deals in the last 30 days to 26 May 2026
Private home sales recorded 1,740 transactions at a median PSF of $2,041, with the latest 30-day pace softer than the prior 60 days.
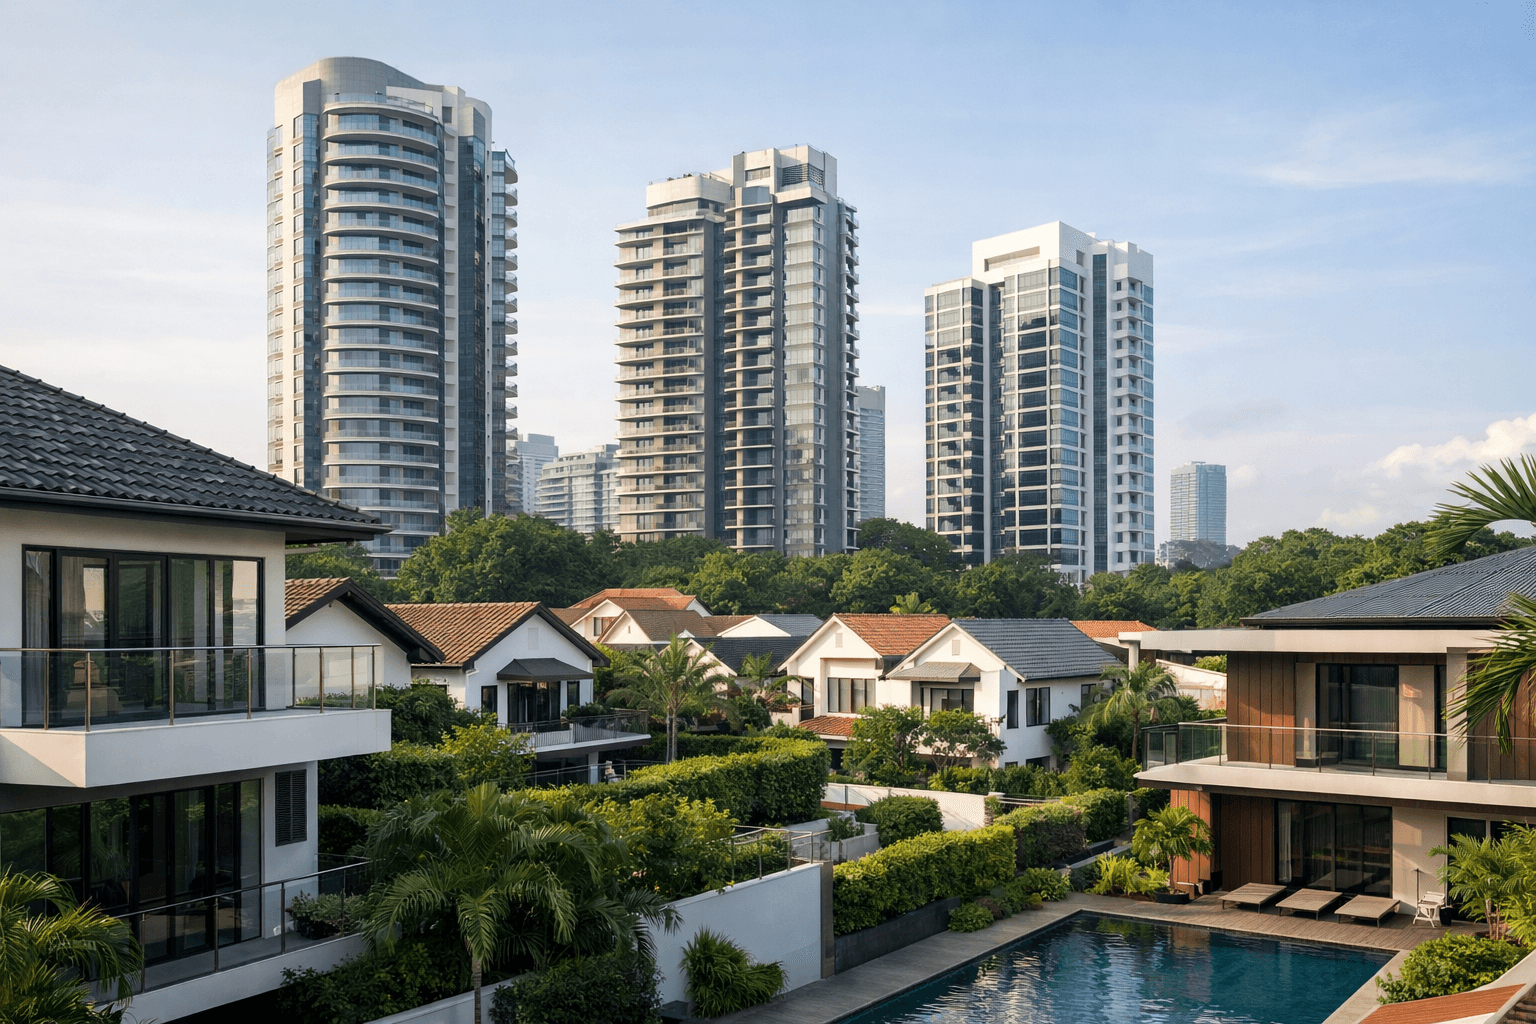
This snapshot covers transacted private home sales in Singapore over the last 30 days to 26 May 2026, using median PSF (price per square foot) and transaction volume from official records.
What is the median PSF for private home sales in Singapore?
The median PSF for private home sales in Singapore was $2,041.
That is the median transacted price per square foot across 1,740 deals in the last 30 days to 26 May 2026.
Are private home prices rising or falling in Singapore?
Private home prices were lower in the latest 30 days, with the median PSF down 4.2% to $2,041 from $2,130 in the prior 60 days.
Transaction volume also eased 48.1% versus the prior 60 days on a per-30-day pace, from 3,353 to 1,740 deals. Recent transactions are filed with a lag, so this window may be revised up later.
How many private home sales were there in the last 30 days?
There were 1,740 private home sales in the last 30 days.
This is the total number of transacted private sales recorded in the window to 26 May 2026.
Which district is the most expensive for private home sales?
The most expensive district for private home sales was D01, Raffles Place, at $2,941 PSF.
It was followed by D05, Buona Vista at $2,451 PSF across 288 deals, and D15, East Coast at $2,428 PSF across 151 deals.
Which district is the most affordable for private home sales?
The most affordable district for private home sales was D25, Woodlands, at $1,259 PSF.
It was followed by D27, Yishun at $1,386 PSF across 53 deals, and D28, Seletar at $1,570 PSF across 29 deals.
What is the median PSF by district for private home sales?
By district, median PSF ranged from $1,259 in D25, Woodlands to $2,941 in D01, Raffles Place.
Other top districts were D05, Buona Vista at $2,451 PSF across 288 deals and D15, East Coast at $2,428 PSF across 151 deals. Other lower-priced districts were D27, Yishun at $1,386 PSF and D28, Seletar at $1,570 PSF.
| District | Transactions | Median PSF |
|---|---|---|
| D01 · Raffles Place | 51 | $2,941 |
| D02 · Tanjong Pagar | 23 | $2,268 † |
| D03 · Tiong Bahru | 51 | $2,372 |
| D04 · Harbourfront | 19 | $1,865 † |
| D05 · Buona Vista | 288 | $2,451 |
| D07 · Bugis | 11 | $2,046 † |
| D08 · Little India | 18 | $1,929 † |
| D09 · Orchard | 53 | $2,401 |
| D10 · Bukit Timah | 79 | $2,411 |
| D11 · Newton | 41 | $2,168 † |
| D12 · Toa Payoh | 33 | $1,774 † |
| D13 · Macpherson | 28 | $2,129 † |
| D14 · Geylang | 60 | $1,680 |
| D15 · East Coast | 151 | $2,428 |
| D16 · Bedok | 76 | $1,719 |
| D17 · Changi | 51 | $1,797 |
| D18 · Tampines | 85 | $1,574 |
| D19 · Hougang | 207 | $1,670 |
| D20 · Ang Mo Kio | 49 | $1,999 † |
| D21 · Upper Bukit Timah | 71 | $2,302 |
| D22 · Jurong | 33 | $1,642 † |
| D23 · Bukit Batok | 102 | $1,722 |
| D24 · Lim Chu Kang | 39 | $2,136 † |
| D25 · Woodlands | 20 | $1,259 † |
| D26 · Upper Thomson | 19 | $1,727 † |
| D27 · Yishun | 53 | $1,386 |
| D28 · Seletar | 29 | $1,570 † |
† Limited sample (fewer than 50 transactions) — treat as indicative only.
How does the median PSF vary by bedroom (by size)?
By bedroom size, median PSF ranged from $1,847 for 5+ bedrooms to $2,361 for 1-bedroom units.
Studio units transacted at $1,877 PSF across 69 deals, 2-bedroom units at $1,938 across 578 deals, 3-bedroom units at $1,970 across 404 deals, and 4-bedroom units at $2,249 across 142 deals.
| Bedroom (by size) | Transactions | Median PSF |
|---|---|---|
| Studio | 69 | $1,877 |
| 1 | 407 | $2,361 |
| 2 | 578 | $1,938 |
| 3 | 404 | $1,970 |
| 4 | 142 | $2,249 |
| 5+ | 140 | $1,847 |
What is the private home sales breakdown by market segment?
The market segment breakdown was 857 OCR deals, 674 RCR deals and 209 CCR deals.
This shows the largest share of private home sales came from the OCR segment, followed by RCR and then CCR.
| By Market Segment | Transactions |
|---|---|
| OCR | 857 |
| RCR | 674 |
| CCR | 209 |
What does the latest private home sales data mean for buyers and sellers?
The latest data shows 1,740 private home sales at a median of $2,041 PSF, with both price and volume softer than the prior 60 days.
District pricing remained wide, from $1,259 PSF in Woodlands to $2,941 PSF in Raffles Place, while segment activity was concentrated in OCR, then RCR and CCR.
Related reading: Singapore Private Home Sale Prices Transactions Overview — 6 June 2026.
Methodology & data sources
This snapshot is built from transacted deals (actual agreed prices), not asking prices.
- Data source: Private Sales from URA private residential transactions, aggregated in PropKaki's database.
- Window: the last 30 days to 26 May 2026, compared against the prior 60 days (volume is compared on a per-30-day pace).
- Metric: Median PSF. PSF is derived as price ÷ floor area.
- Reporting lag: recently transacted deals are filed over several weeks, so the latest window may be revised upward as more records are lodged.
- Disclaimer: figures are for general information only and are not a valuation, recommendation, or financial advice.
Got a question this raised? Ask PropKaki.
Take any point from this analysis and apply it to your own project, budget or decision.
 PropKaki
For most buyers this year, staying well within budget beats trying to time the market.