
The Condos That Lost Money in Singapore (by Real Resale Data)
Across 267,641 matched private resales, the projects where owners most often sold at a loss cluster in one place: prime central and Sentosa Cove luxury bought near a peak. The worst, Turquoise, had a −43.2% median and not one profitable resale in the data.
Across 267,641 matched private resales, the projects where owners most often resold at a loss cluster in prime CCR and Sentosa Cove luxury bought near a peak. The worst by median gain was Turquoise, a Sentosa Cove condo: a −43.2% median gross loss, −$2.58M, with 0% of its 31 matched pairs profitable over a typical 10-year hold. Others include Seascape (−32.8%, −$1.97M), Marina Collection (−32.4%, −$1.92M) and The Scotts Tower (−38.0%). The pattern reinforces the region finding — prime had the lowest odds of profit — because big quantums, rich entry prices and heavy exposure to cooling measures and foreign demand made these the hardest resales to clear. The load-bearing caveat: each figure is a per-project median, not every unit — some owners in these projects still profited. Every figure is gross, before commission, duties and interest.
Every study of Singapore property profit eventually gets asked the uncomfortable question: not where owners made money, but where they lost it. Naming projects is fair game here — this is public URA matched-pair data, reported per project, with no unit numbers and no individuals — so we will report it straight, as data.
We matched 267,641 private resale transactions into buy-and-sell pairs — the same unit bought, then later sold — and ranked projects by how their resales performed. The bottom of that ranking tells a coherent story. It is not scattered across the island; it concentrates in the prime Core Central Region and in Sentosa Cove, among big-quantum luxury homes bought at rich prices near a market peak. That is the mirror image of what the region study found — that prime central had the lowest odds of profit — seen from the losing end. Before a single project name, though, one caveat is load-bearing and comes first: every figure below is a median across a project's matched pairs, not a claim that every unit in it lost. Some owners in these projects profited; the median simply fell below cost. This guide walks the loss leaderboard, why these projects sit there, and how to read a number like this without misreading it.
Which condos lost the most money on resale in Singapore?
Ranked by median gross loss across their matched resale pairs, the worst was Turquoise, a Sentosa Cove condo: a −43.2% median, −$2.58M, with 0% of its 31 pairs profitable. Seascape (−32.8%), Marina Collection (−32.4%) and The Scotts Tower (−38.0%) follow — almost all prime CCR or Sentosa luxury. But each figure is a per-project median, not a claim that every unit lost.
There is a clear answer to "which projects lost owners the most on resale," and the list is strikingly consistent. Rank every private project by the median gain across its matched resale pairs — the same unit bought, then later sold — and the bottom is dominated by prime central and Sentosa Cove luxury.
The worst by median was Turquoise, a condo in Sentosa Cove (CCR): a −43.2% median gross loss, a median dollar loss of −$2.58M, and 0% of its 31 matched pairs profitable over a typical 10-year hold — the only project on the leaderboard where not a single matched resale in the data cleared its purchase price. Close behind:
- The Scotts Tower (CCR condo): −38.0% median, −$1.05M, 4% profitable across 24 pairs.
- Seascape (CCR condo, Sentosa Cove): −32.8% median, −$1.97M, 4% profitable across 27 pairs.
- Marina Collection (CCR condo, Sentosa Cove): −32.4% median, −$1.92M, 7% profitable across 30 pairs.
- Helios Residences (CCR apartment): −26.1% median, −$1.19M, 7% profitable across 56 pairs.
Before you read another line, hold the caveat that governs this entire piece: these are per-project medians, not a verdict on every unit. A −32% median means the typical matched pair in that project sold below cost — not that every owner did. Some owners in these projects profited; the median simply fell below the purchase price. We come back to this, because it is the single easiest thing to misread here.
The full leaderboard, the reasons these projects cluster together, and how to use a number like this are below. This spoke sits under the pillar on how to tell if your property will be profitable; to model a specific project and entry price, use the property profitability model.
What did we measure, and is it fair to name projects?
Every figure is a per-project median across that project's matched private resale pairs — the same unit's real buy and sell price — for projects with at least 20 pairs. Gains are gross, before commission, duties and interest. Naming is fair: this is public URA matched-pair data reported per project, with no unit numbers and no individuals.
A list that names projects has to be scrupulous about method and about what it is entitled to say. Here is exactly what sits behind every figure below.
- Matched pairs, not an index. We paired private homes with a recorded purchase and a later sale, so we compare the same unit's buy price to its own sell price. An index averages different homes selling in different periods; matched pairs remove that noise.
- A per-project median. For each project we take the median gain across all its matched pairs, and rank projects by that median. So "−32%" describes the middle pair in a project, not the project as a whole and not any one unit — a distinction that carries the whole piece.
- At least 20 pairs per project. Every project named here has 20 or more matched resale pairs, so a headline figure is a real signal across dozens of transactions, not one unlucky flip. (Small-project medians can swing hard on a single deal; the pairs count, n, is shown for every row.)
- Private only. URA private caveats — condos, apartments, executive condominiums and landed — not HDB, which behaves differently.
- Gross, not net. "Loss" here means the sale price fell below the purchase price. It does not add back agent commission, buyer's or seller's stamp duties, legal fees or loan interest — all of which make the owner's real position worse, so these gross losses understate the true damage.
- Genuine holds. Pairs that turned over in under 180 days are excluded as sub-sale noise, so this is real ownership.
Is it fair to name them? Yes. This is public URA matched-pair transaction data, aggregated to the project level, with no unit numbers, no floor references and no individuals — exactly the granularity URA itself publishes. Reporting a project's median resale outcome is a factual statement about public data, not a judgement of the development, its residents or its developer. We report it as data, and read every number as "what usually happened to matched resales in this project," not "what will happen to a unit there today."
What is the full loss leaderboard for Singapore condos?
Fifteen projects with the lowest median gains, current to 23 June 2026. Turquoise led at −43.2% (0% profitable), then Valley Apartments (−38.8%), The Scotts Tower (−38.0%), Seascape (−32.8%), Viewpoint Condominium (−32.5%) and Marina Collection (−32.4%). Thirteen of the fifteen are CCR; the two exceptions sit in RCR and OCR. Every row is a per-project median.
Here is the full leaderboard from the matched pairs — the fifteen private projects with the lowest median gross gain, each with at least 20 matched resale pairs, current to 23 June 2026.
| Project | Type | Region | Median gain % | Median gain $ | % profitable | Median hold | Pairs (n) |
|---|---|---|---|---|---|---|---|
| Turquoise | Condo | CCR | −43.2% | −$2.58M | 0% | 10y | 31 |
| Valley Apartments | Apartment | CCR | −38.8% | −$352k | 20% | 1y | 20 |
| The Scotts Tower | Condo | CCR | −38.0% | −$1.05M | 4% | 9y | 24 |
| Seascape | Condo | CCR | −32.8% | −$1.97M | 4% | 9y | 27 |
| Viewpoint Condominium | Condo | RCR | −32.5% | −$556k | 37% | 6y | 84 |
| Marina Collection | Condo | CCR | −32.4% | −$1.92M | 7% | 12y | 30 |
| Nam Peng Centre | Apartment | OCR | −27.5% | −$202k | 35% | 2y | 20 |
| Helios Residences | Apartment | CCR | −26.1% | −$1.19M | 7% | 11y | 56 |
| Olivio | Apartment | CCR | −21.0% | −$207k | 41% | 4y | 56 |
| Scotts Square | Apartment | CCR | −19.5% | −$642k | 12% | 10y | 87 |
| Robinson Suites | Apartment | CCR | −18.6% | −$319k | 13% | 11y | 30 |
| Cityvista Residences | Condo | CCR | −18.6% | −$1.10M | 30% | 14y | 30 |
| Fernhill Apartment | Apartment | CCR | −16.3% | −$360k | 18% | 2y | 28 |
| Oue Twin Peaks | Condo | CCR | −14.9% | −$311k | 7% | 8y | 100 |
| Marina Bay Suites | Condo | CCR | −14.7% | −$632k | 14% | 12y | 65 |
Three things stand out. First, the list is overwhelmingly prime central. Thirteen of the fifteen projects are in the Core Central Region; only Viewpoint Condominium (RCR) and Nam Peng Centre (OCR) sit outside it. This is not a scatter of unlucky projects across the island — it is a concentration in one segment.
Second, the dollar losses are large because the homes are expensive. The steepest median dollar loss, Turquoise's −$2.58M, is a Sentosa Cove figure — a big-quantum luxury home where even a moderate percentage fall is a seven-figure sum. Seascape (−$1.97M), Marina Collection (−$1.92M) and Helios Residences (−$1.19M) tell the same story: prime quantums turn a percentage loss into a very large cheque.
Third, the low '% profitable' figures are what make these projects notable. Turquoise's 0%, Seascape's and The Scotts Tower's 4%, Marina Collection's and Oue Twin Peaks' 7% — in these projects the typical matched resale sold below cost, and only a small minority cleared their price. That is the exception across the whole market, where 85.3% of private resales profited. These are the projects that ran hardest against that grain.
A note on the two short-hold rows: Valley Apartments (median hold 1y) and Nam Peng Centre and Fernhill Apartment (2y) turned over faster than the decade-long holds typical of the Sentosa names, so their medians rest on quicker in-and-out sales rather than long holds that never recovered. The pattern of why the long-hold prime losers cluster together is next.
Did every unit in these projects lose money?
No — and this is the caveat that matters most. Each figure is a median across a project's matched pairs, so it describes the middle resale, not every unit. Some owners in these projects still profited. Turquoise's 0% is the rare exception where no matched pair in the data cleared its cost; most rows have a real minority who did.
This is the single most important thing to get right about the whole leaderboard, so it gets its own section: a project's median loss is not a claim that every unit in it lost money.
A median is the middle of a distribution. When Marina Collection shows a −32.4% median, it means the typical matched resale there sold about 32% below its purchase price — and the '% profitable' column tells you the rest of the shape. Marina Collection's 7% profitable means that among its 30 matched pairs, roughly two still sold above cost even as the median fell well below it. Olivio (41% profitable), Viewpoint Condominium (37%) and Nam Peng Centre (35%) had substantial minorities of owners who cleared their price despite a negative project median. A loss-leaderboard headline describes the centre of gravity, not every point in the cloud.
The one row where the strict reading holds is Turquoise at 0% profitable — the only project here where not a single one of its 31 matched pairs, in this data, sold above its purchase price. Even there, the honest framing is precise: in the matched pairs we have, none profited. It is not a metaphysical claim that no unit could ever profit; it is what the recorded resales show.
Why labour this? Because the natural misreading is costly in both directions. Read "−32% median" as "everyone there lost" and you libel the owners who did fine and write off a project that may transact very differently today. Read it as "so I definitely won't lose" because a few profited, and you ignore that the typical outcome was a large loss. The correct read sits between: in these projects, the odds ran against the owner, and the middle outcome was a loss — but the middle is not everyone. Hold that, and the table informs you instead of misleading you.
Why did these losses cluster in prime central and Sentosa Cove?
The data shows the cluster; it does not, by itself, say why. The most plausible reasons are structural: prime and Sentosa homes carry the biggest quantums and richest entry prices, and lean hardest on foreign and investor demand — exactly what cooling measures target. Big entry cost plus switchable demand made these the hardest resales to clear.
The leaderboard establishes that the losses concentrate in prime central and Sentosa Cove — thirteen of fifteen in CCR, several in Sentosa. It does not, on its own, prove why, so treat what follows as interpretation of a real pattern, not a second data claim. Two structural forces plausibly explain most of it, and they line up exactly with what the region study found from the winning end.
Rich entry prices leave less room to grow. These are among the most expensive homes per square foot in Singapore, and many were bought at or near a market peak. The more you pay in, the more the market must move just to clear your cost — and a home bought at the top of a cycle can wait a very long time for the next up-cycle to overtake its price. Because the quantums are so large, that shortfall is a seven-figure cheque: Turquoise's median loss was −$2.58M, Seascape's −$1.97M, Marina Collection's −$1.92M. This mirrors the pillar's market-wide finding that the priciest-entry buys had by far the weakest odds and thinnest gains — and prime and Sentosa are where those entries concentrate.
Prime and Sentosa lean hardest on demand that can switch off. This segment relies most on foreign and investor buyers — precisely the demand that Additional Buyer's Stamp Duty and successive cooling measures target. When foreign-buyer duties rose and sentiment turned, the prime and Sentosa segment felt it first and hardest, while owner-occupier-led suburban demand held up better.
So these projects pair the highest entry cost with the most switchable demand — a harder starting point for a profitable exit than the cheaper suburbs, compounded by lease decay eating into the older names over a decade-long hold. None of it makes these bad places to own or live; it is why prestige and profit odds turned out to be two different things. The full region breakdown is in where owners profited most — CCR vs RCR vs OCR, the mirror image of this list.
What does Sentosa Cove tell us about buying prime luxury near a peak?
Sentosa Cove supplies several of the steepest losses — Turquoise (−43.2%, −$2.58M), Seascape (−32.8%, −$1.97M) and Marina Collection (−32.4%, −$1.92M) — all over decade-long holds. It is the clearest case study in the data of big-quantum luxury bought near a peak, then held through cooling measures and a thinner foreign-buyer pool.
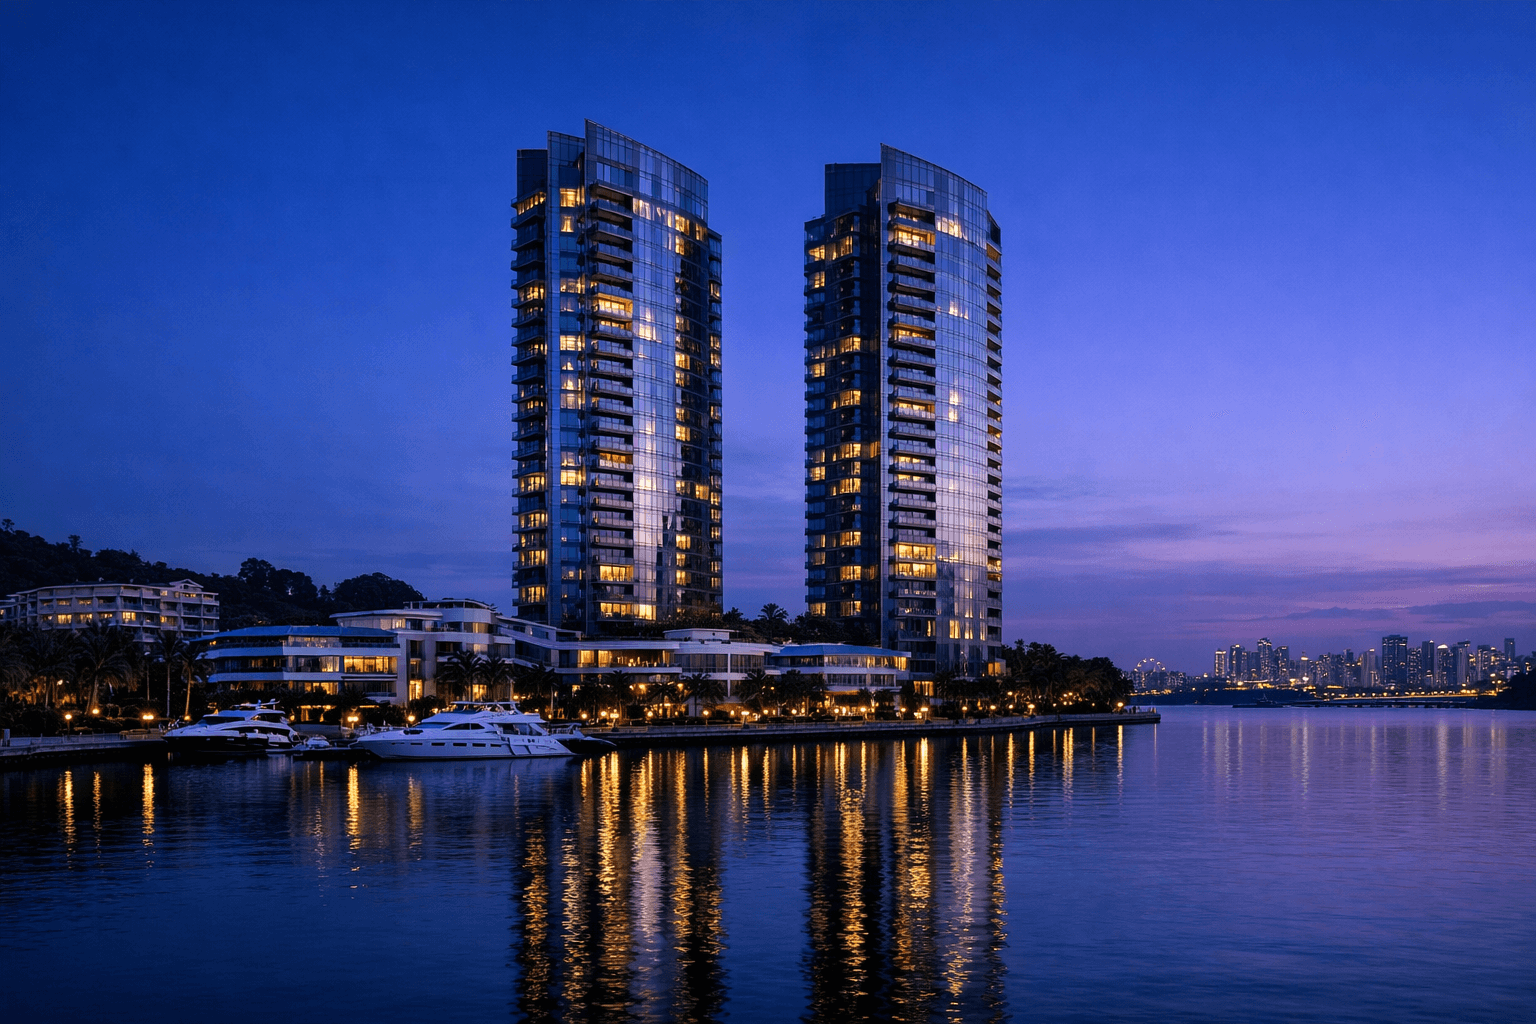
If you want the pattern in one place, Sentosa Cove is it. Three of the leaderboard's steepest losses — Turquoise (−43.2%, −$2.58M, 0% profitable, n=31), Seascape (−32.8%, −$1.97M, 4%, n=27) and Marina Collection (−32.4%, −$1.92M, 7%, n=30) — are Sentosa Cove condos, each over a median hold of 9 to 12 years. Together they are the clearest case study in this dataset of what buying prime luxury near a peak looked like on the way back out.
The waterfront enclave was sold, at launch, largely to foreign and investor buyers at some of the highest quantums in the country — precisely the profile most exposed when the rules changed and the overseas-buyer pool thinned. A home bought at an earlier luxury-market high, then held for the better part of a decade into that environment, is the recipe behind these median losses of −$1.92M to −$2.58M. These are long holds that never recovered their entry, not quick flips.
The lesson is not "prime luxury always loses" — it plainly does not across the whole market, and the winners list names plenty of prime projects that did well. It is narrower and more useful: a rich entry price into a segment that leans on switchable demand is the most fragile combination when the rules tighten. The bigger the quantum and the more the demand depends on a single buyer pool, the more a peak entry can cost you — and the longer you may hold waiting for it to come back. For the older names, a second force compounds it over a long hold: lease decay quietly eroding value as the tenure runs down — see when to sell before lease decay hurts resale and how lease decay hits condo prices.
How should you use a loss leaderboard like this?
As a base rate and a warning about a combination, not a verdict on any project today. It tells you that rich-entry, big-quantum, demand-sensitive homes bought near a peak carried the worst odds historically — so weigh entry price against the cycle, and judge a specific unit by its own recent comparables, not by its worst decade.
A list of past losers is easy to misuse. It is not a blacklist, and it is not a forecast — it is a historical base rate that should sharpen two judgements without making them for you.
Read it as a caution about a combination, not a curse on a postcode. What these projects share is not merely an address — it is rich entry prices, big quantums and heavy reliance on switchable foreign demand, several bought near a peak. That combination carried the worst odds in the data. The usable signal is to price it in: if you are buying into prime or Sentosa at an elevated PSF, you are starting from a lower base rate and a bigger cost to clear, so the specific project and price have to justify it. The suburbs, entered cheaper, started friendlier — the exact point the region study makes from the winning side.
Judge the unit by its own numbers, not by its worst decade. A project's historical median says what happened to matched resales, many bought in a different market a decade ago. It does not tell you what a unit there would fetch today, after prices, supply and sentiment have all moved. A name on this list can transact very differently now than its ten-year median implies — so if you are weighing a specific unit, pull its recent comparables, check its entry PSF against its own history, and plan a hold long enough to ride out a soft patch. A past median is a starting point you adjust with fresh comparables, never the finish.
The honest one-line use: this list tells you which combination of features fought the owner hardest, so you can price that risk — not which project to cross off. To turn that into an estimate for a specific project, size and entry price, use the property profitability model; for the segment picture behind the whole pattern, see where owners profited most, and the forthcoming mirror of this piece, the most profitable condos in Singapore.
What's the biggest mistake people make reading a list like this?
Reading a project's median loss as "every unit here lost." It's a median across matched pairs — the middle outcome, not everyone's — and most rows have a real minority who still profited. The mirror mistake is assuming prime luxury can't fall; these projects are the proof it can. Judge the unit, not the headline.
The biggest mistake is turning a per-project median into a blanket verdict — in either direction. One reader sees "Marina Collection −32.4%" and concludes everyone there lost their shirt; they didn't, since 7% of its pairs still sold above cost and projects like Olivio (41% profitable) had large minorities who cleared their price. The mirror reader assumes prime and luxury addresses simply can't fall — and this entire list is the counter-evidence that the most prestigious, most expensive segment produced the steepest losses in the data.
Three corrections keep you honest. First, a median is not everyone — read it with the '% profitable' column, which tells you how many bucked it; only Turquoise's 0% comes close to a literal "everyone lost," and even that describes the matched pairs on record, not a law of nature. Second, gross is not net — every loss here is before commission and duties, which make the owner's real position worse still. Third, a ten-year median is not today's price — a project on this list is judged by its own recent comparables, not by its worst decade. Anchor on the headline number and you'll misjudge both the project and your own odds; anchor on the unit and the distribution, and the list becomes a risk map instead of a hit list.
Common questions about condos that lost money in Singapore
The worst project by median was Turquoise; a project median doesn't mean every unit lost; and the losses concentrating in prime and Sentosa is the mirror of prime having the lowest profit odds — the details are below.
Which Singapore condo lost the most money on resale? By median gross loss across its matched resale pairs, Turquoise — a Sentosa Cove condo in the Core Central Region — was the worst: a −43.2% median, a median dollar loss of −$2.58M, and 0% of its 31 matched pairs profitable over a typical 10-year hold. By dollar loss it also led, because Sentosa Cove quantums are among the highest in Singapore. This is a per-project median across matched private pairs, gross of commission, duties and interest — a base rate, not a verdict on a unit there today.
Does a project median loss mean every unit in it lost money? No. Each figure is a median across the project's matched pairs — the middle resale, not every unit. Most projects on the list have a real minority of owners who still sold above cost: Olivio was 41% profitable, Viewpoint Condominium 37%, Nam Peng Centre 35%, even as their medians fell below cost. The one near-exception is Turquoise at 0% profitable, where no matched pair in the data cleared its purchase price. Read a median as "the typical resale," not "all of them."
Why did the losses cluster in prime central and Sentosa Cove? The data shows the cluster; the likely reasons are structural. Prime and Sentosa homes carry the biggest quantums and richest entry PSF, and lean hardest on foreign and investor demand — exactly what cooling measures and higher foreign-buyer stamp duties target. Many were bought near a peak, then held through a decade of tighter rules and a thinner buyer pool, with lease decay eroding the older names. That is the mirror of the region finding that prime central had the lowest odds of profit — the same forces, seen from the losing end. Every figure here is gross, before commission, duties and interest.
Methodology and sources
Where every figure comes from — and what we deliberately did not claim.
What we counted. Per-project medians across matched private resale pairs from URA private caveats (condos, apartments, executive condominiums and landed), for projects with at least 20 matched pairs, current to 23 June 2026. A "pair" is one unit with a recorded purchase and a later sale, so we compare the same home's buy and sell price; sub-sale flips under 180 days are excluded as noise. The loss leaderboard, each project's median gross gain (percentage and dollar), its percentage of pairs profitable, its median hold and its pair count, and the worst-project facts (Turquoise, −43.2%, 0% profitable, n=31) are derived from PropKaki's project_profit_stats_mv — a GROUP BY over resale_pairs_mv — with project names joined from condo_projects. The 85.3% overall private profitable rate is the pillar's profitability_base_rate anchor.
What we did not claim. That any of these numbers is a forecast — they are historical base rates that move with the market, and a project on this list can transact very differently today than its ten-year median implies. That a project median is a verdict on every unit — it is the middle of a distribution, and most projects here had a minority of owners who still profited; only Turquoise's 0% approaches the literal "every pair lost" reading, and even that describes the matched pairs on record. That gross equals net — every loss is stated before agent commission, buyer's and seller's stamp duties, legal fees, interest and maintenance, so the owner's real loss is larger, not smaller. That naming a project judges the development, its residents or its developer — we report public URA matched-pair data aggregated to the project level, with no unit numbers and no individuals. That the why behind the pattern is a data claim — the explanations (rich entry prices, big quantums, exposure to cooling measures and foreign demand, lease decay) are our interpretation of a real pattern, not something the pairs themselves assert. Small-project medians rest on relatively few pairs and can swing on a single deal; the pair count (n) is shown for every row so low-n figures can be read as indicative. This is general information, not financial advice. To assess a specific unit, use the property profitability model.
Got a question this raised? Ask PropKaki.
Take any point from this analysis and apply it to your own project, budget or decision.
 PropKaki
For most buyers this year, staying well within budget beats trying to time the market.